
Introduction
In this article, we’ll explore a guideline methodology to unlock capacity with the power of bottlenecks analysis in malting and brewing.
Note: This article presents a practical guideline methodology. A more detailed technical version — including case studies, advanced modeling techniques, and field applications — is in preparation for future industry conferences.
In the world of malting and brewing, precision and timing are everything. From grain processing to fermentation, each step in the production chain must flow seamlessly to ensure high-quality output and cost-effective operations. However, bottlenecks—whether in raw material handling, energy consumption, or fermentation delays—can slow down production, increase waste, and impact profitability.
Unlocking production capacity is rarely achieved through isolated equipment upgrades alone. True capacity gains come from an integrated approach — combining demand analysis, utility alignment, equipment efficiency (OEE), and continuous debottlenecking simulation. By systematically mapping capacity versus demand, and addressing constraints through iterative simulations, breweries and maltings can flexibly meet market needs while minimizing capital investment. The following steps outline this structured method.
While the integrated debottlenecking approach applies across the full brewing-maltings value chain, the nature of capacity constraints and improvement opportunities differs slightly between malting and brewing operations. Understanding these process-specific dynamics is key to driving the right actions in each area:
Malting is a delicate balance of timing, resource management, and operational efficiency. Each stage—steeping, germination, kilning, and inter-phase transportation—relies on seamless transitions to avoid production delays and inefficiencies. However, bottlenecks can emerge due to equipment maintenance challenges, water and energy supply limitations, and enhanced by suboptimal operational efficiency (OEE). These constraints can reduce plant capacity, impact yield quality, and increase costs.
Brewing is a highly integrated process where precision, timing, and resource flow are critical to maintaining product quality and operational efficiency. Each stage — mashing, lautering, wort boiling, fermentation, maturation, and packaging — must operate in harmony to avoid production delays and inefficiencies. Bottlenecks can arise from equipment constraints, fermentation tank availability, utility limitations (such as cooling capacity or CO₂ recovery), and suboptimal operational efficiency (OEE). These limitations can restrict brewhouse throughput, extend cycle times, impact product quality consistency, and increase production costs.
Packaging is often the ultimate capacity constraint in breweries, as it directly impacts the ability to meet market demand. Each component — filling, labeling, pasteurization (if applicable), and secondary packaging — must be synchronized to avoid downtime and product hold-ups. Bottlenecks can arise from equipment limitations, frequent changeovers, utility constraints (compressed air, cooling), or line inefficiencies driven by poor OEE. Improving packaging line flow and flexibility is often one of the most cost-effective ways to boost total brewery throughput and responsiveness to customer needs.
By identifying constraints in malt processing, brewing cycles, and packaging, breweries and malt houses can streamline operations, reduce downtime, and enhance sustainability. Whether through automation, optimized resource allocation, best practices or innovative solutions, eliminating bottlenecks leads to higher capacity, better product consistency, and improved profitability.
By evaluating OEE performance metrics and addressing key bottlenecks, maltings can unlock additional throughput beyond existing capacity, ensuring sustainability and profitability.
Key Strategies for Applying an Integrated Debottlenecking Model
The following step-by-step approach helps maltings and breweries systematically identify, prioritize, and resolve capacity constraints — with minimal capital investment and maximum impact on flexibility and cost.
1- Demand Analysis — Integrate Seasonal Peak Fluctuations
Production must align with market demand, which varies across peak seasons and specific product requirements.
Storage strategies for raw materials and finished products should support both high and low demand periods.
Demand analysis forms the foundation for identifying where and when capacity constraints will become critical.
2- Calculate Technical Capacity vs Demand — Compare the nominal technical capacity of each process step and utility system against actual and projected demand. Identify gaps where capacity may be insufficient to meet peak demand periods.
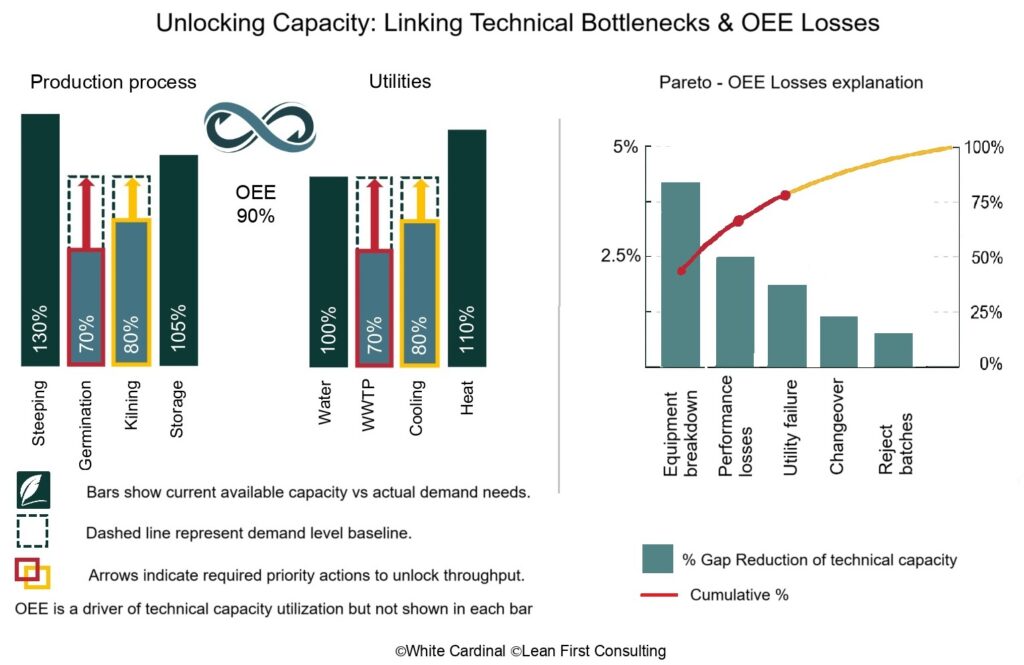
3- Visual tools enable aligned action — Visualizing capacity gaps and priorities helps engage cross-functional teams (production, utilities, maintenance) in coordinated, data-driven debottlenecking efforts. The visual below maps current technical capacity utilization across key production steps and utilities (simplified malting process taken as example) compared to actual demand needs. It highlights where targeted debottlenecking efforts can most effectively unlock additional throughput.
4- Align Utilities usage to Capacity Needs
Energy usage: Heat demands fluctuate, requiring peak and seasonal optimization for efficiency.
Water supply: Steeping phases require variable water intake, which must align with local availability, permits and cost.
Utility constraints can create temporary bottlenecks, requiring flexible response strategies. A model needs to calculate precisely the utilities needs across the full year simulating the production peaks.
5- Integrate OEE into Capacity Calculations — Equipment efficiency (OEE) directly impacts technical capacity and must be considered before investing in capacity increases:
Low OEE (e.g. 50%) often indicates improvement opportunities that can free up existing capacity faster and more cost-effectively than equipment expansion.
A benchmark OEE of 90% can guide optimization efforts.
Capacity vs Demand gaps should be analyzed using effective capacity (actual output at current OEE), not just nominal equipment capacity.
6- Prioritize OEE Improvement with Pareto of Losses — Not all OEE losses contribute equally to capacity constraints — applying Pareto analysis helps focus improvement on the top drivers:
Use a Pareto chart (80/20 principle) to identify major OEE loss categories: unplanned downtime, maintenance delays, changeover time, quality rework, minor stops.
Often, improving 1–2 key areas (e.g. maintenance practices or changeover standardization) can yield significant capacity gains without equipment investment.
Regular Pareto review ensures improvement actions remain aligned with current bottlenecks as demand and production mix evolve.
7- Develop a Catalogue of Solutions and Best Practices — Develop and maintain a catalogue of innovative ideas, best practices, standards, and ready-to-implement solutions to support continuous improvement and capacity optimization.
8- Apply Continuous Debottlenecking through Scaled Simulations — Debottlenecking should be an iterative, simulation-driven process:
Each debottlenecking project should account for the new technical capacity it generates — ensuring the system remains balanced.
Solutions should be stress-tested against seasonal demand fluctuations and changing utility constraints.
Scaled simulations help anticipate new bottlenecks emerging after initial improvements, visualized in a roadmap waterfall graph.
Key Messages :
1- Prioritizing bottlenecks unlocks true capacity gains
Addressing the most constrained steps — such as Germination and WWTP — delivers the greatest impact on overall system output, often more effectively than broad efficiency programs.
2- Utilities must be treated as part of production capacity
Constraints in utility systems (e.g. Cooling, Wastewater Treatment) can limit production even when core processing steps have surplus capacity. Effective capacity planning must integrate both production and utilities.
3- OEE is necessary but not sufficient — capacity vs demand must guide actions
High OEE (e.g. 90%) indicates good equipment performance, but production flow is determined by how each step meets demand. Mapping capacity vs demand across the value stream ensures that improvements target real system constraints.
4- Visual tools drive cross-functional alignment
Clear visualization of capacity gaps and priorities fosters alignment between operations, engineering, maintenance, and management — enabling coordinated, data-driven debottlenecking efforts.
Business Value of Debottlenecking: Beyond Efficiency Gains
Debottlenecking has clear business value and strategic flexibility impact.
Strategic debottlenecking unlocks value far beyond process efficiency — enabling breweries and maltings to optimize make vs buy decisions, defer capital, and strengthen market position.
1- Increased Responsiveness to Market Demand
- Enhanced internal capacity allows for greater flexibility in producing specialty malts or responding to seasonal peaks.
- This improves customer satisfaction and enables differentiation in product offerings.
2- Capital Efficiency
- Strategic debottlenecking delays or eliminates the need for major capital investment in full capacity expansions.
- Targeted upgrades (e.g. improved cooling, WWTP capacity) extend the life and value of existing assets.
3- Cost Reduction through Improved Scale
- Higher internal malt production reduces unit costs via better utilization of fixed costs.
- It also optimizes logistics and internal supply chain integration.
4- Risk Mitigation
- Increased internal capacity reduces reliance on volatile external malt markets.
- This helps stabilize costs and supply assurance in uncertain market conditions.
In a vertically integrated brewing-maltings structure, the business value of debottlenecking is amplified — not only improving efficiency but strengthening competitive position, supply flexibility, and financial performance. It unlocks strategic flexibility that can directly improve the bottom line with Make vs. Buy Leverage
Debottlenecking key process steps delivers value far beyond OEE improvements or energy savings. Internal malting capacity constraints often force breweries to purchase malt externally at higher market prices. By selectively debottlenecking internal malting steps (e.g. germination, kilning), breweries can increase internal production, reducing external purchases and improving margin.
Conclusion
In today’s competitive brewing and malting industry, an integrated Lean debottlenecking approach not only drives operational excellence — it delivers lasting business value through greater flexibility, optimized capital deployment, and improved margins. This practical approach enables breweries and maltings to future-proof their operations and better respond to evolving market demands.
References
1- Approaches to Debottlenecking and Process Optimization – Rick Johnston May 1, 2012 – Bioprocess international
2- Step Up Debottlenecking Success | Chemical Processing | Chemical Processing Dave Litzen – July 5, 2016
3- Energy Targeting for a Brewing Process Using Pinch Analysis – Noah Tibasiima, Aldo Okullo – 2017
4- Enhancing Operational Efficiency in Craft Beer Production: Implementation of Lean Manufacturing and TPM Methodologies in SMEs – Ronald Wilmer Perez-Peralta, Adonis Meza-Estrada, Martin Collao Diaz & Juan-Carlos Quiroz-Flores – 2024
5 – Biomanufacturing Debottlenecking and Process Optimization
6 – Debottlenecking of sustainability performance for integrated biomass supply chain: P-graph approach – ScienceDirect – Bing Shen How, Tze Tin Yeoh, Tiong Kean Tan, Kok Hui Chong, Devi Ganga, Hon Loong Lam – 2018
© 2025 White Cardinal. All rights reserved.
Leave a Reply